Earlier work · Knowledge graphs
A visual toolset forintegrationwithout engineers
FactGem let business analysts integrate graph data on their own. I designed the two interfaces that made it possible: WhiteboardR to model the business, MappR to map the data.
- Type
- Knowledge-graph data fabric
- Role
- Product design: model and mapping
- Tools
- WhiteboardR and MappR
- Users
- Business analysts, not engineers
- Era
- Earlier work, a decade-long throughline
01Context
Integration used to need engineers.
FactGem was a knowledge-graph data fabric built on Neo4j. It pulled scattered source systems into one connected model.
The catch was who could do it. Building and mapping a graph model was engineering work. The people who understood the data were business analysts.
The old way was swivel-chair integration. Analysts moved data between systems by hand in Excel. It was slow and it did not scale.
The answer was a two-part visual toolset. Model the business, then map the data. No code at either step.
02Model · WhiteboardR
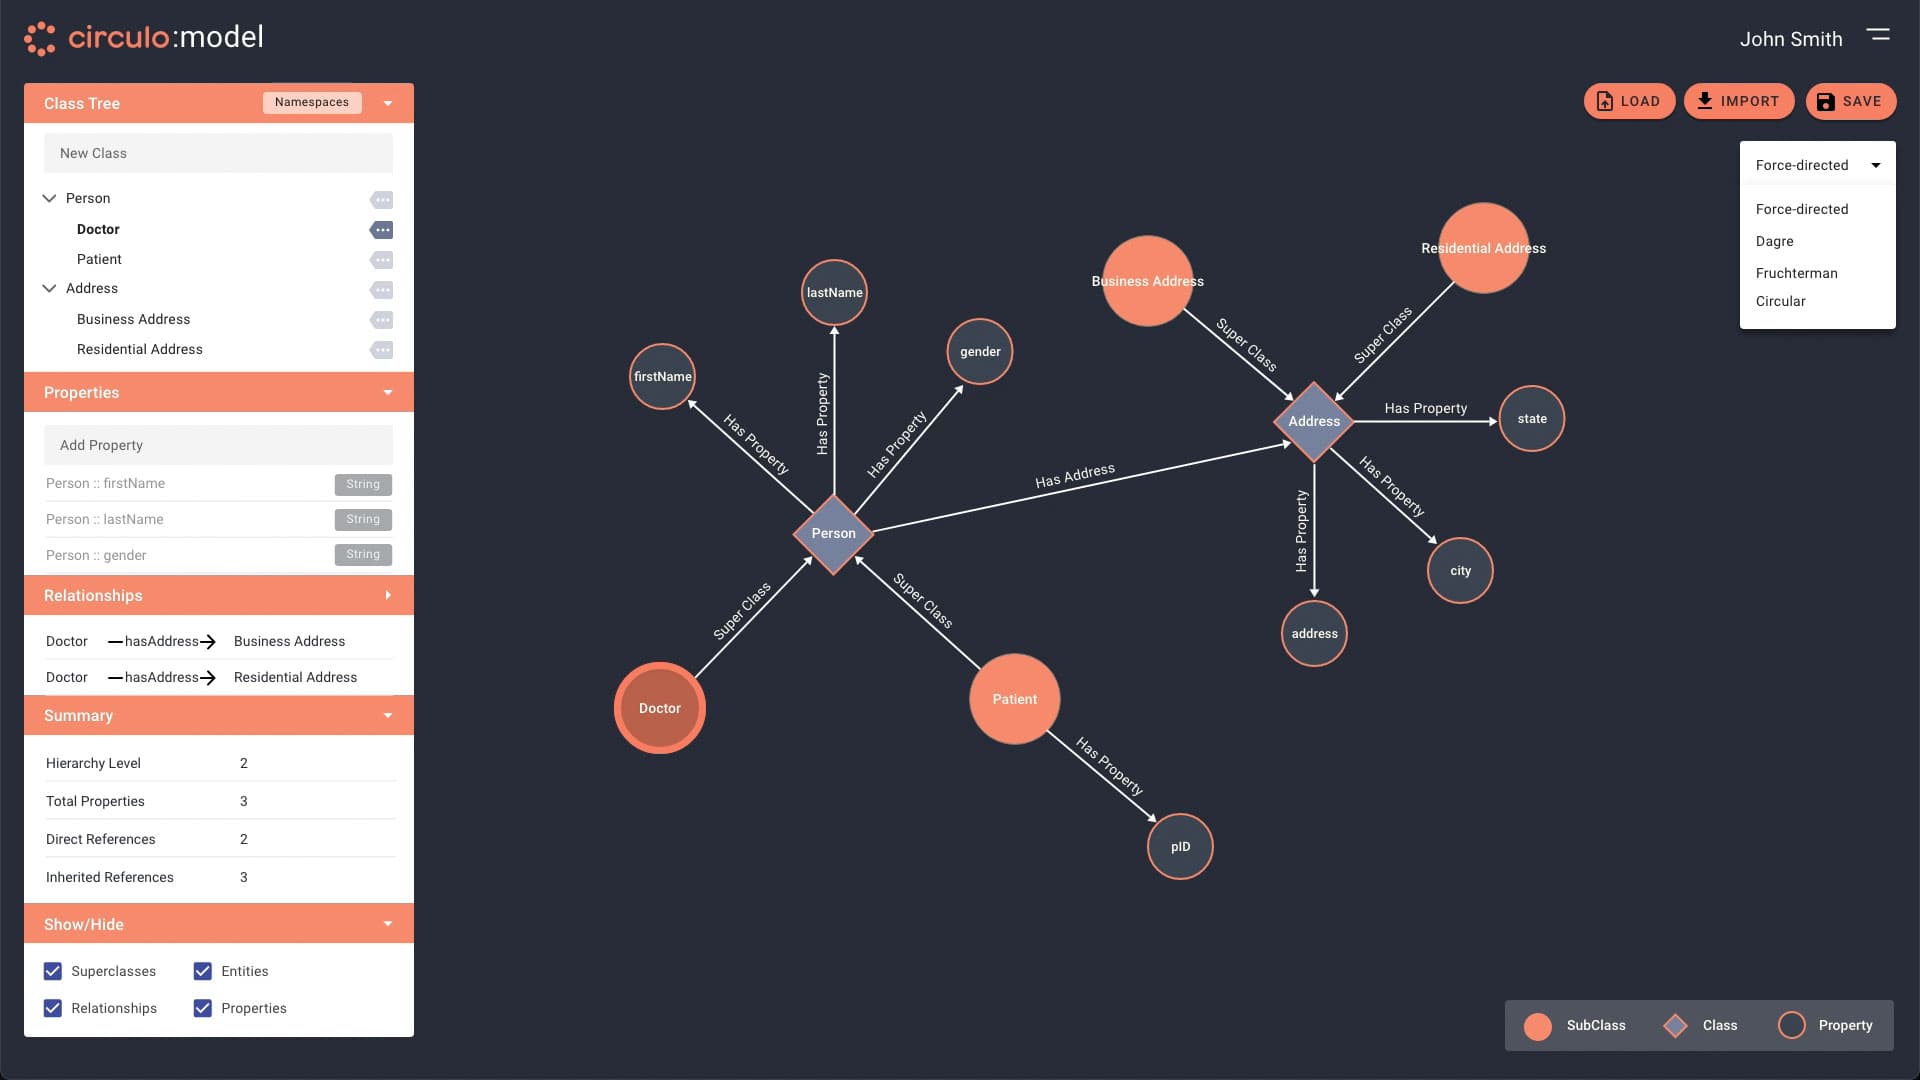
Draw the business as a graph.
WhiteboardR is a visual canvas. An analyst draws their business as entities and the relationships between them.
No database knowledge required. You place a class, connect it, give it properties. The schema stays visible on the canvas instead of hidden in code.
I designed this canvas so a non-technical user could build a real graph model by direct manipulation.
Make the schema visible, not implied.
03Map · MappR
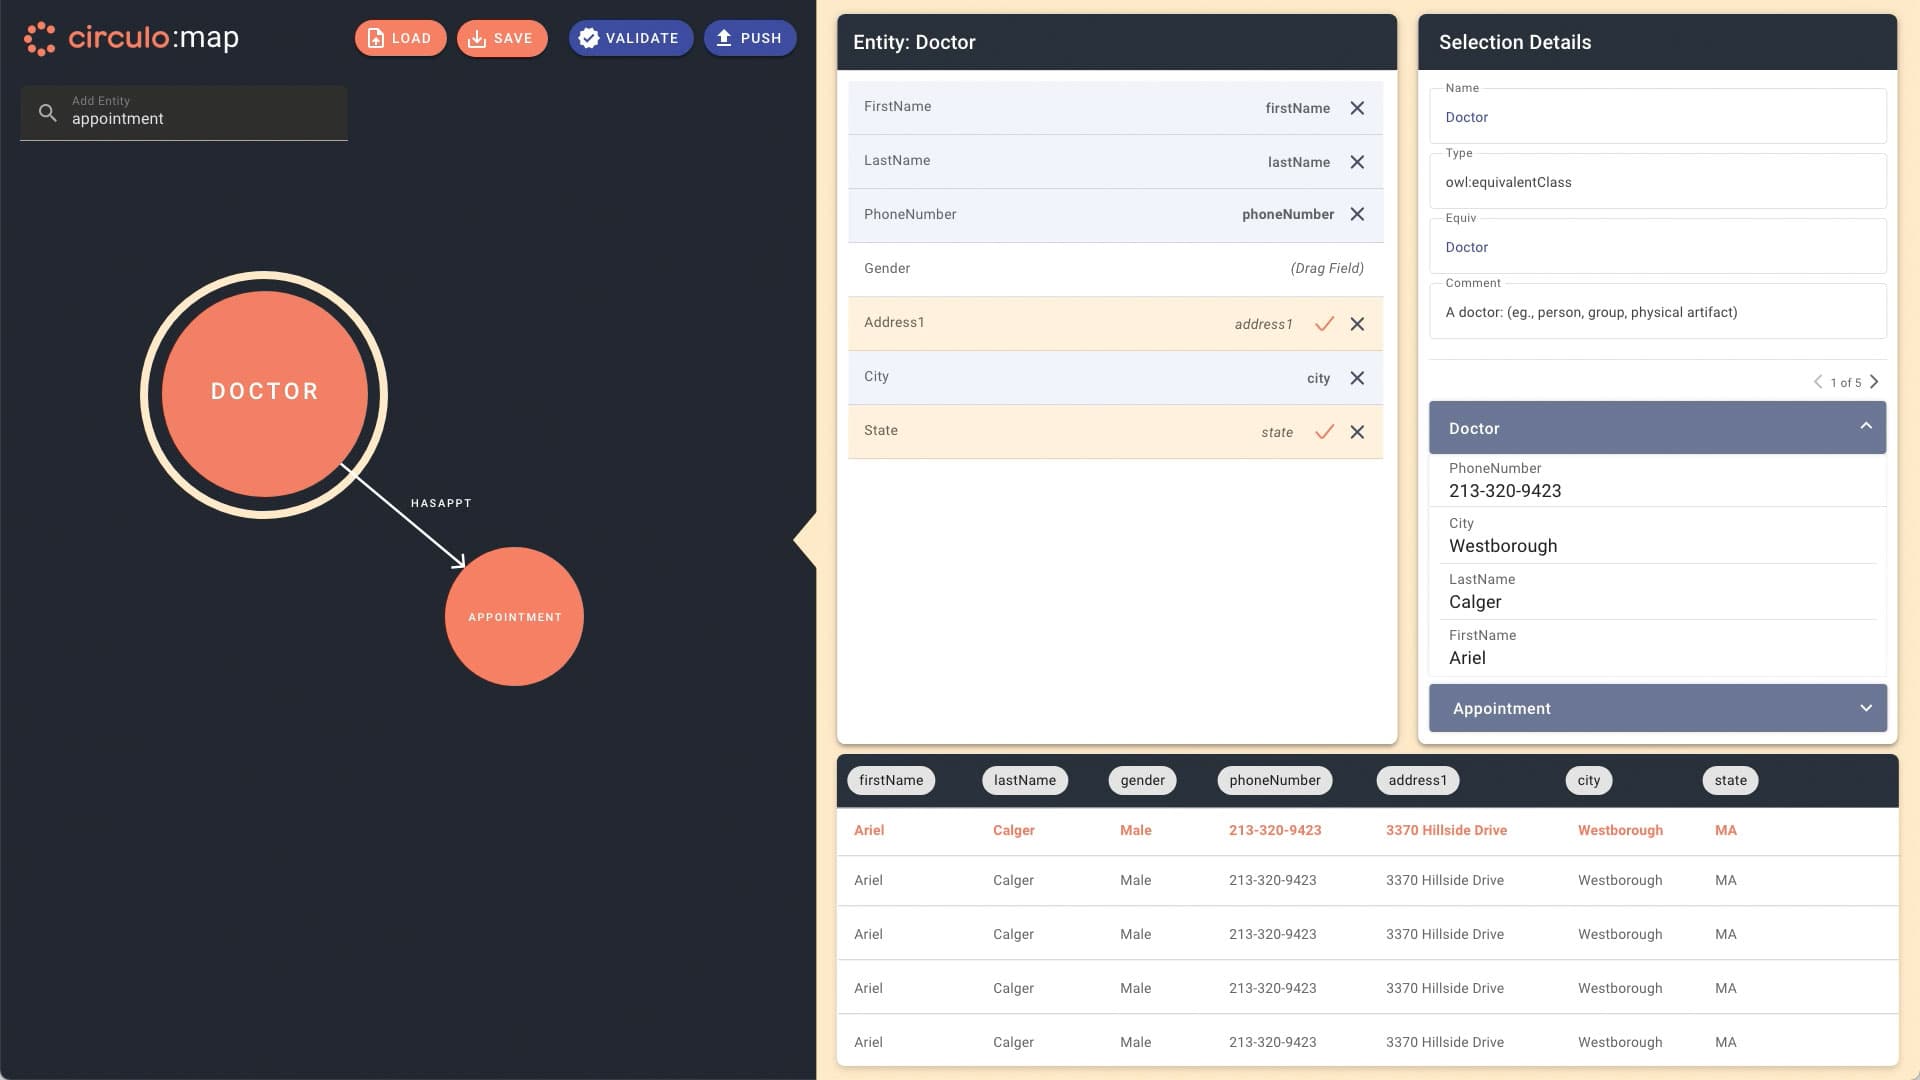
Map messy columns onto the model.
Once the model exists, the data has to meet it. MappR is a drag-and-drop interface for binding source-system columns to the model you drew.
The hard problem was identity. When a record arrives, is it a new entity or an update to one that already exists? Most systems settle that in backend configuration.
We surfaced it in the interface. MappR shows the candidate matches and lets the analyst resolve identity in view, as they map.
I designed that mapping interface. It moved a decision that usually lives in engineering config into the analyst’s hands.
Identity is a design decision, not a config file.
04Proof · The retailer
Analysts did the work themselves.
A Fortune 500 Midwest retailer replaced its swivel-chair Excel integration with this toolset. A routine market-basket analysis had taken the team six days.
With WhiteboardR and MappR the company reached a working proof of concept in hours and a production deployment in roughly 14 weeks with two developers. Business analysts did the modeling and the mapping on their own.
Those are company and engineering outcomes. My part was the interfaces that made non-technical integration possible.
05Throughline
A model is a contract. So is a design system.
A graph model is a contract between messy source data and a clean shared model. WhiteboardR and MappR existed to keep those two in agreement while non-engineers did the work.
The work I do now is the same instinct one layer up. A design-system contract keeps a design system and the agents that consume it in agreement.
Different domain, a decade apart, the same orientation. I work at the seam where two representations have to be reconciled. Design the system, then build the system.